Plot Summaries of Posterior Distribution of pibblefit Parameters
Source:R/pibble_plotting.R
plot.pibblefit.RdPlot Summaries of Posterior Distribution of pibblefit Parameters
Usage
# S3 method for class 'pibblefit'
plot(x, ...)Details
Other arguments:
`par` parameter to plot (options: Lambda, Eta, and Sigma) (default="Lambda")
`focus.cov` vector of covariates to include in plot (plots all if NULL)
`focus.coord` vector of coordinates to include in plot (plots all if NULL)
`focus.sample` vector of samples to include in plot (plots all if NULL)
`use_names` if TRUE, uses dimension names found in data as plot labels rather than using dimension integer indices.
Examples
sim <- pibble_sim(N=10, D=4, Q=3)
fit <- pibble(sim$Y, sim$X)
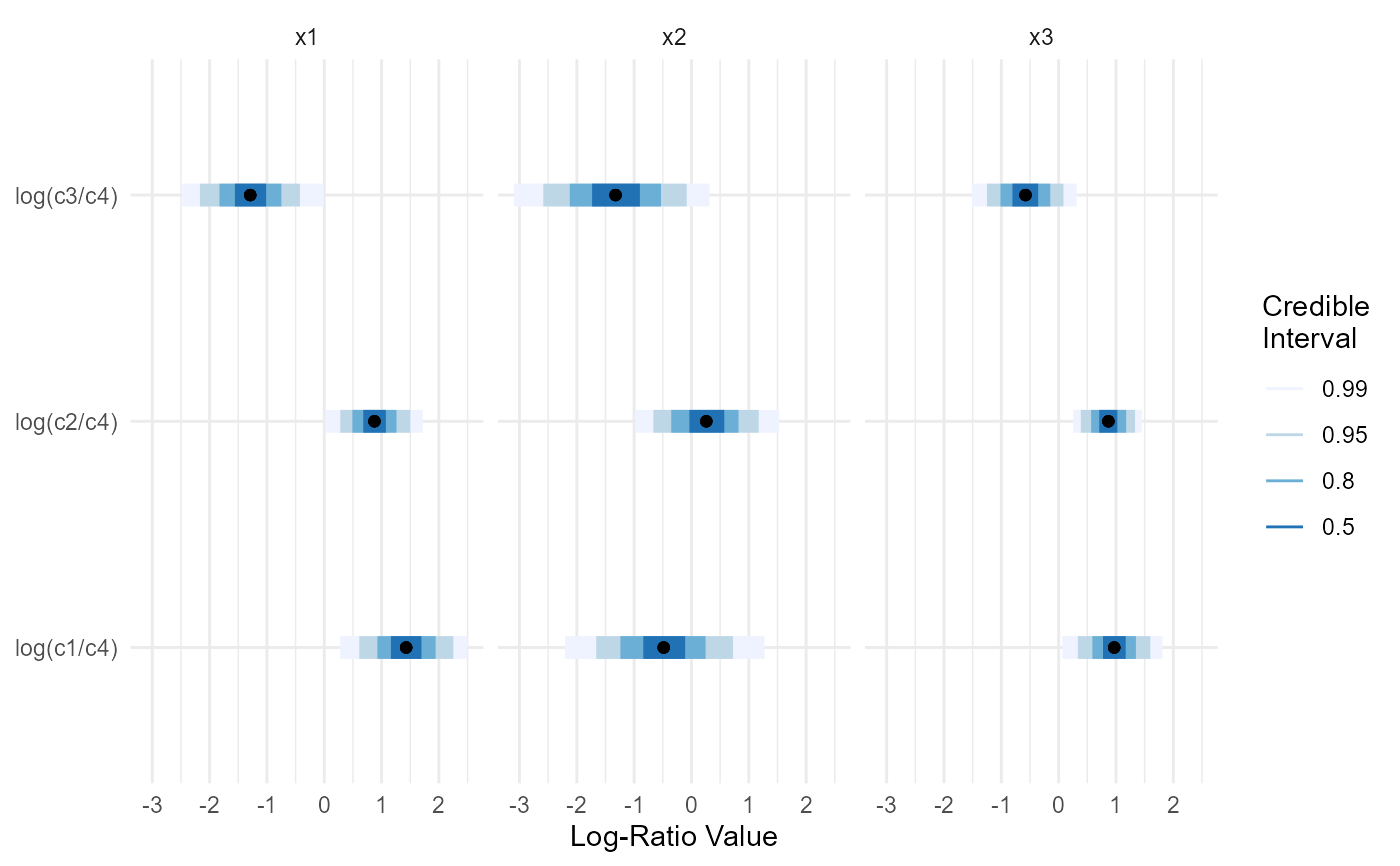
plot(fit, par="Lambda")
#> Scale for colour is already present.
#> Adding another scale for colour, which will replace the existing scale.
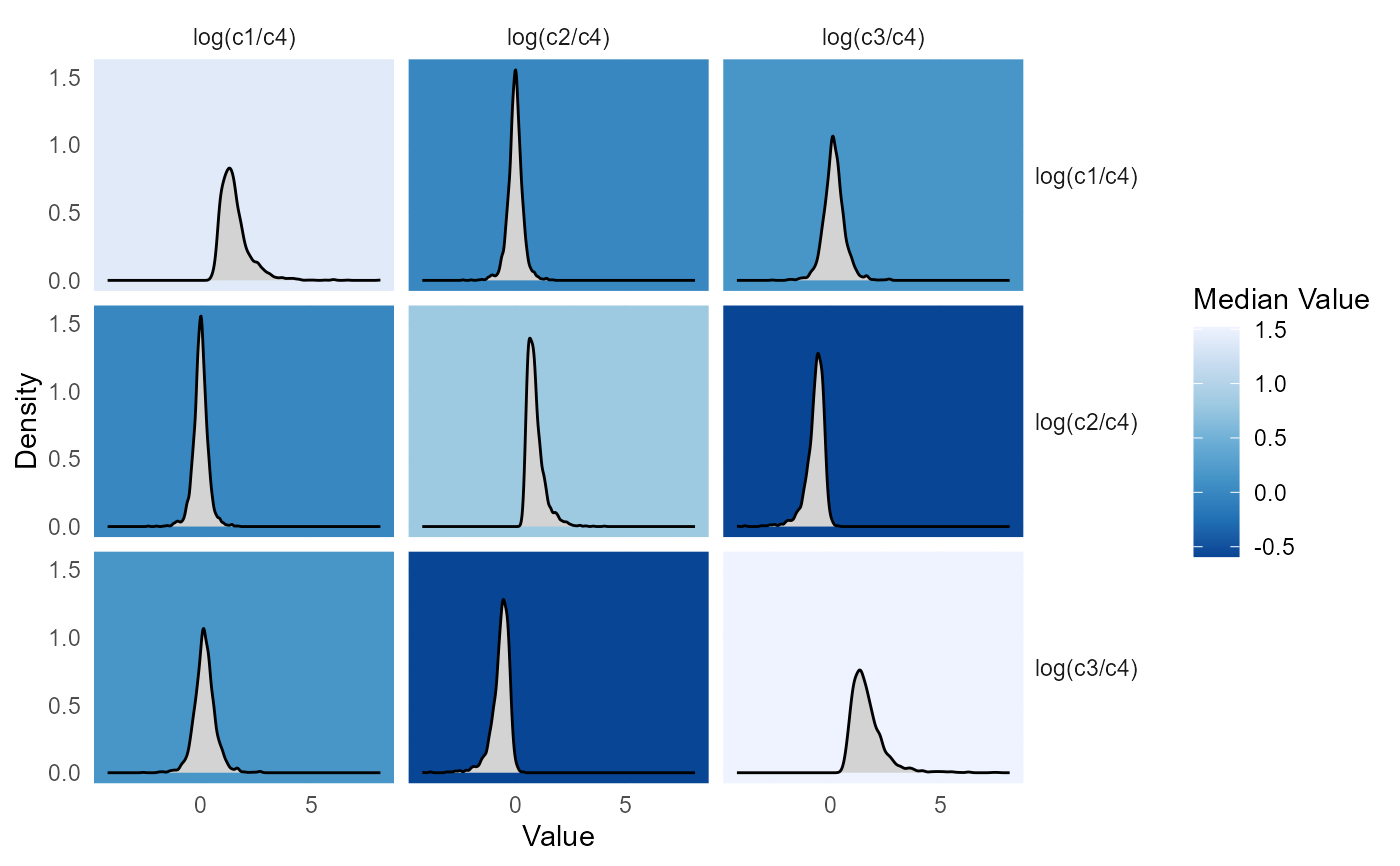
 plot(fit, par="Sigma")